

Storm Deployment Pulse
Storm Deployment Pulse
How to determine from your Enterprise installation data whether the system is being used and whether usage is becoming regular. This guide is intended for the deployment owner, administrator, and BI analyst: a unified action log, nine analytical scenarios, SQL queries, and recommendations for interpreting the results.
- Download SQL queries — creation of a view and 11 queries for nine scenarios; run the required blocks separately.
All charts are embedded in this page as SVG, and the queries are provided below in SQL blocks with a copy button. The charts use conditional data, not a connection to your database. To obtain actual metrics, run the SQL on your installation's data and connect the results to your BI system.
How to Start
- Prepare an analytical copy of the Storm database in PostgreSQL 12+ or a storage with compatible SQL and tables from the recipe. For reports, a daily update is sufficient.
- Verify the table and column composition against your version. SELECT privileges are required for reading; CREATE privileges in the selected analytical schema are required for creating a view. If these privileges are not available, use a CTE, as described below.
- Create the view
v_storm_user_actionsfrom the "Unified Action Log" section. Checksearch_pathor specify the schema before the table and view names. - Start with query 1: it shows the weekly audience and authors over 28 days. Then add segments (4a), retention (2–3), and the live database (5).
- In queries 8a and 8b, replace the example
DATE '2026-09-15'with your mailing date. Compare the result after the 28-day window has completed. - Create cards based on the "BI System Dashboard Layout" table and agree with the implementation owner on a regular review of the results.
What to consider before comparison
- Version and modules. If the tables for disabled modules are missing, exclude the corresponding branches
UNION ALLand related metrics. Ifsm_users.deleted_onis absent, remove the check for this column in queries 4a and 9. Simulation events are not included in the recipe. - Service users. Exclude them sequentially from the journal and user selections. Queries 6 and 7 also read the source tables directly — a filter applied only to the view will not affect them.
- Observation window. The current week and month are incomplete. Query 3 excludes users with a history of less than 28 days, but the final week of the cohort may contain only a subset of new users. Compare fully observed periods and use a single time zone.
- Incomplete history. Entries do not reflect every visit, and the
last_interacted_atwiki stores the last interaction, not the history of all views. The first recorded activity may differ from the actual start of work. - Empty results. In queries with inner joins, periods without activity may be missing. In BI, distinguish between the absence of data and zero; use a calendar for continuous series. In the cohort table, do not convert months that have not yet occurred into zeros.
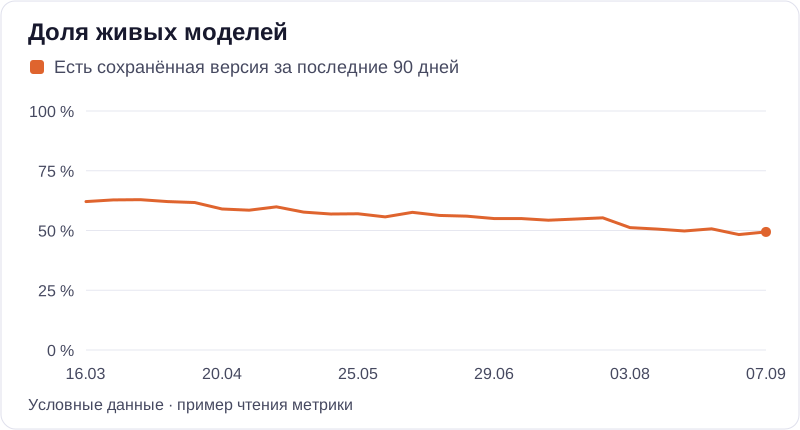
- Model base. Query 5 applies the current deletion flag and does not restore the historical composition of the base for each week. "Live model" in it means the presence of a saved version within 90 days, not a view by a reader.
- Different core definitions. In 4a, it is 10 or more contributions over 28 days; in 4b — 3 or more over 14 days. For a common dashboard, align the threshold and window.
- Email campaign effect. Query 8b compares all active participants of two calendar weeks, including existing users; the return window is counted from the week of the email campaign, not from each person's first action. For new users, also use query 3. Such a comparison by itself does not prove a causal effect of the email campaign.
Why raw events look like a mess
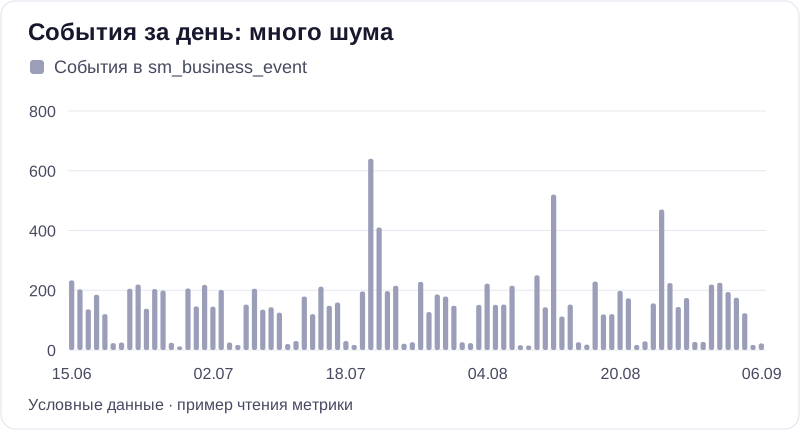
If you plot the number of events per sm_business_event per day, you get a sawtooth pattern with no trend. This is not a tracking failure, but rather four properties of the data.
login Login is recorded at authentication, and the session lasts up to 7 days. A person working every day generates one event
loginper week. It answers the question "was the user in the system this week," not "how many times they logged in."version The process model version is not written on every autosave. It is written every 20th autosave and when the author changes. One editing session results in one to three versions, not a hundred.
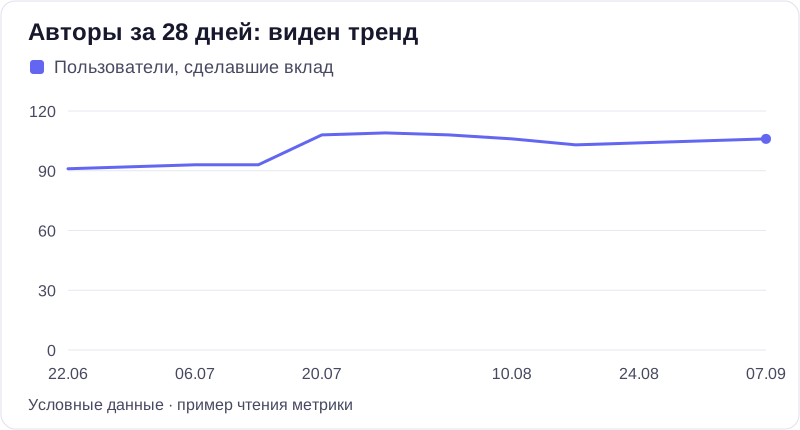
cycle Work on processes happens in waves. An analyst spends a week drawing, two weeks approving, and a month not touching it. Daily and weekly absolute values fluctuate; the trend is visible over 28-day moving averages and in cohorts.
on-prem The on-prem installation within the perimeter does not have page view events.
page_view_*are written only in the cloud version. Model views by readers are not directly visible — readers are visible through logins and wiki page views.
From this, three rules:
count people, not events
look at the week and 28 days, not the day
compare cohorts, not absolutes
Unified Action Log
The analysis relies on a single view — the user action log. It joins events from sm_business_event with facts from application tables: process models, versions, comments, approvals, registry, wiki, and AI. Each action belongs to one of two families.
| Source | What is counted | Family |
|---|---|---|
| sm_business_event · login | system login (no more than once a week per user) | presence |
| sm_wiki_page_user_activity | opened a wiki page | presence |
| sm_diagrams | created a process model | contribution |
| sm_diagram_versions | saved a version (manual or automatic) | contribution |
| sm_comments, sm_comment_messages | wrote a comment | contribution |
| sm_approvals | requested approval / made a decision | contribution |
| sm_processes | initiated a process in the registry | contribution |
| sm_customfield_value_history, sm_entity_change_history | changed a process attribute | contribution |
| sm_assignees, sm_assets | created a role or resource in the reference data | contribution |
| sm_wiki_page_versions | wrote in the wiki | contribution |
| sm_business_event · ai_, mcp:: | interacted with the AI assistant or via MCP | contribution |
Presence — the user was in the system, "showed up." Contribution — the user did something, "worked." The difference between them is the key metric to observe: the system may be open to everyone, but only ten people will actually work in it.
CREATE OR REPLACE VIEW v_storm_user_actions AS
-- Присутствие
SELECT user_id, "timestamp" AS ts, 'login' AS kind, 'presence' AS family
  FROM sm_business_event WHERE user_id IS NOT NULL AND name IN ('login', 'first_login')
UNION ALL SELECT user_id, last_interacted_at, 'wiki_view', 'presence'
  FROM sm_wiki_page_user_activity
-- Вклад: модели
UNION ALL SELECT author, created_on, 'diagram_create', 'contribution'
  FROM sm_diagrams WHERE author IS NOT NULL
UNION ALL SELECT user_id, created_on, 'diagram_edit', 'contribution'
  FROM sm_diagram_versions WHERE user_id IS NOT NULL
-- Вклад: обсуждение и согласование
UNION ALL SELECT user_id, created_on, 'comment', 'contribution'
  FROM sm_comments WHERE user_id IS NOT NULL
UNION ALL SELECT author_user_id, created_on, 'comment', 'contribution'
  FROM sm_comment_messages WHERE author_user_id IS NOT NULL
UNION ALL SELECT created_by, created_on, 'approval_request', 'contribution'
  FROM sm_approvals WHERE created_by IS NOT NULL
UNION ALL SELECT approver, approval_time, 'approval_decision', 'contribution'
  FROM sm_approvals WHERE approver IS NOT NULL AND approval_time IS NOT NULL
-- Вклад: реестр процессов и справочники
UNION ALL SELECT created_by, created_on, 'process_create', 'contribution'
  FROM sm_processes WHERE created_by IS NOT NULL
UNION ALL SELECT created_by, created_on, 'process_attr', 'contribution'
  FROM sm_customfield_value_history WHERE created_by IS NOT NULL
UNION ALL SELECT changed_by, changed_on, 'process_attr', 'contribution'
  FROM sm_entity_change_history WHERE changed_by IS NOT NULL
UNION ALL SELECT author, created_on, 'reference', 'contribution'
  FROM sm_assignees WHERE author IS NOT NULL
UNION ALL SELECT author, created_on, 'reference', 'contribution'
  FROM sm_assets WHERE author IS NOT NULL
-- Вклад: вики, ИИ
UNION ALL SELECT created_by, created_on, 'wiki_edit', 'contribution'
  FROM sm_wiki_page_versions WHERE created_by IS NOT NULL
UNION ALL SELECT user_id, "timestamp", 'ai', 'contribution'
  FROM sm_business_event
 WHERE user_id IS NOT NULL
   AND name IN ('ai_chat_message_sent', 'ai.generate_bpmn', 'ai.complete_bpmn', 'ai.analyze_process')
UNION ALL SELECT user_id, "timestamp", 'mcp', 'contribution'
  FROM sm_business_event WHERE user_id IS NOT NULL AND name LIKE 'mcp::%';
Notes. Deleted models and versions are not excluded — the action occurred. Exclude service accounts (vendor administrator, integration keys) via AND user_id NOT IN (…). Events from the simulations module are not accounted for in this recipe, so sm_simulations is not included in the log. If the view cannot be created — insert its body as WITH v_storm_user_actions AS MATERIALIZED (…) at the beginning of each query. If the query already starts with WITH, add the log as the first CTE and separate the next CTE with a comma. If your version lacks the sm_users.deleted_on column (added in August 2026), remove the AND u.deleted_on IS NULL condition from queries 4 and 9.
1 How many people are actually using
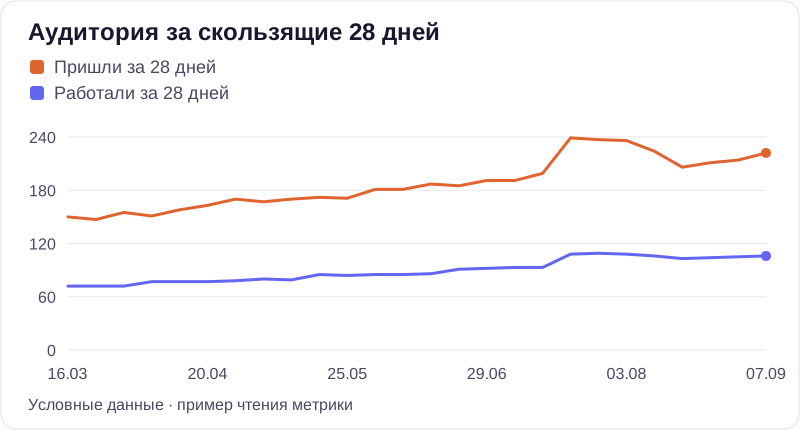
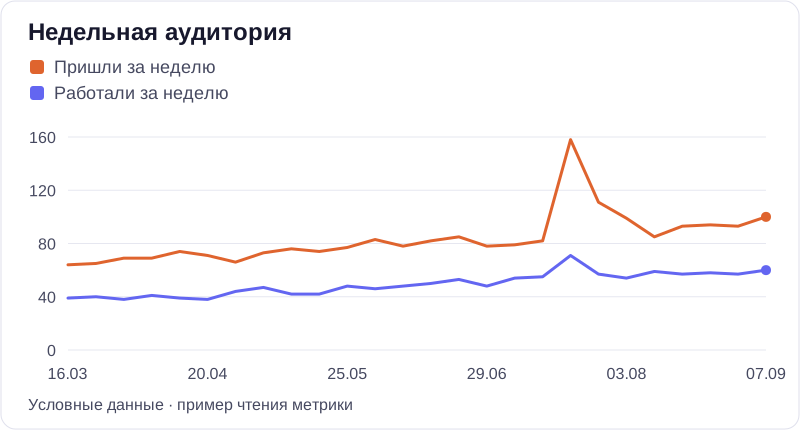
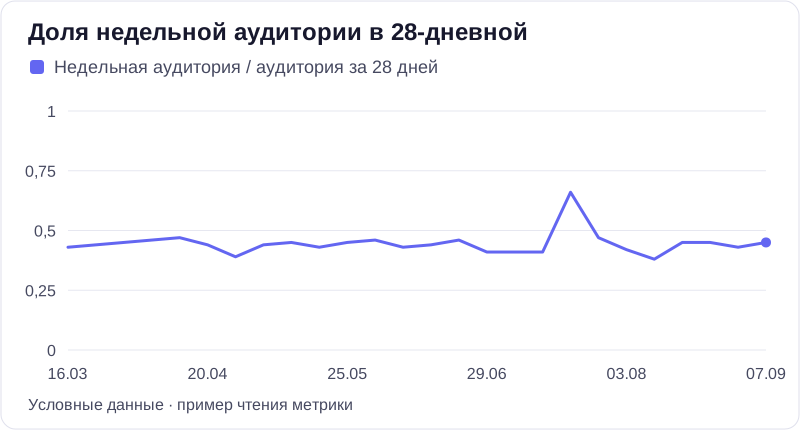
The main chart. Audience for the week and for a rolling 28-day period, with "arrived" and "worked" shown separately. Plus stickiness — the share of the monthly audience that arrives every week.
WITH weeks AS (
  SELECT generate_series(date_trunc('week', NOW() - INTERVAL '26 weeks'),
                         date_trunc('week', NOW()), '1 week')::date AS week
)
SELECT w.week,
  COUNT(DISTINCT a.user_id) FILTER (WHERE a.ts >= w.week AND a.ts < w.week + 7)                                   AS users_week,
  COUNT(DISTINCT a.user_id) FILTER (WHERE a.family = 'contribution' AND a.ts >= w.week AND a.ts < w.week + 7)     AS contributors_week,
  COUNT(*)                  FILTER (WHERE a.family = 'contribution' AND a.ts >= w.week AND a.ts < w.week + 7)     AS contributions_week,
  COUNT(DISTINCT a.user_id) FILTER (WHERE a.ts >= w.week + 7 - 28 AND a.ts < w.week + 7)                          AS users_28d,
  COUNT(DISTINCT a.user_id) FILTER (WHERE a.family = 'contribution' AND a.ts >= w.week + 7 - 28 AND a.ts < w.week + 7) AS contributors_28d,
  ROUND(COUNT(DISTINCT a.user_id) FILTER (WHERE a.ts >= w.week AND a.ts < w.week + 7)::numeric
        / NULLIF(COUNT(DISTINCT a.user_id) FILTER (WHERE a.ts >= w.week + 7 - 28 AND a.ts < w.week + 7), 0), 2) AS stickiness
FROM weeks w
JOIN v_storm_user_actions a ON a.ts >= w.week + 7 - 28 AND a.ts < w.week + 7
GROUP BY 1 ORDER BY 1;
How to read. Look at whether authors over 28 days are growing — not the number of actions per week, which is noisy. The range of 0.3–0.5 can be used as an example, not a universal norm; a drop below your own baseline means people are logging in once a month just to "take a look."
2 Do We Retain Users — Cohorts
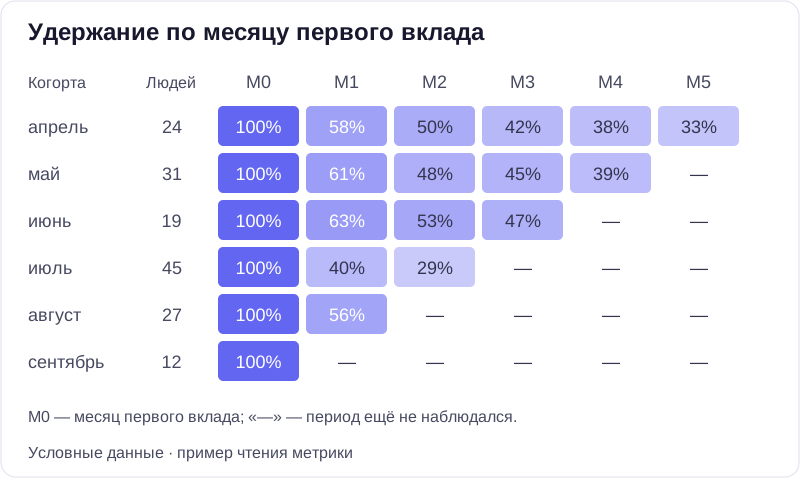
A cohort is the month of the first contribution. For each cohort, the metric is the proportion of users who performed at least one action in month N after their first month. This slice helps distinguish sustainable adoption from a constant influx of users who quickly stop using the system.
WITH first_act AS (
  SELECT user_id, date_trunc('month', MIN(ts))::date AS cohort
  FROM v_storm_user_actions WHERE family = 'contribution' GROUP BY user_id
),
cohort_size AS (SELECT cohort, COUNT(*) AS users FROM first_act GROUP BY cohort),
monthly AS (
  SELECT DISTINCT user_id, date_trunc('month', ts)::date AS month
  FROM v_storm_user_actions WHERE family = 'contribution'
)
SELECT f.cohort, cs.users AS cohort_size,
       ((EXTRACT(YEAR FROM m.month) - EXTRACT(YEAR FROM f.cohort)) * 12
         + EXTRACT(MONTH FROM m.month) - EXTRACT(MONTH FROM f.cohort))::int AS month_n,
       COUNT(*) AS active,
       ROUND(100.0 * COUNT(*) / cs.users, 1) AS pct
FROM first_act f
JOIN cohort_size cs USING (cohort)
JOIN monthly m USING (user_id)
WHERE f.cohort >= date_trunc('month', NOW() - INTERVAL '12 months')
GROUP BY 1, 2, 3 ORDER BY 1, 3;

-- Вариант «когорта по первому заходу»: замените family = 'contribution'
-- на family = 'presence' в first_act и уберите условие в monthly.
In the BI system: a pivot table with rows cohort, columns month_n, and values pct. If event tracking was enabled later than when users started working, discard the first cohort — it will contain all the "veterans."
3 Do Newcomers Settle In
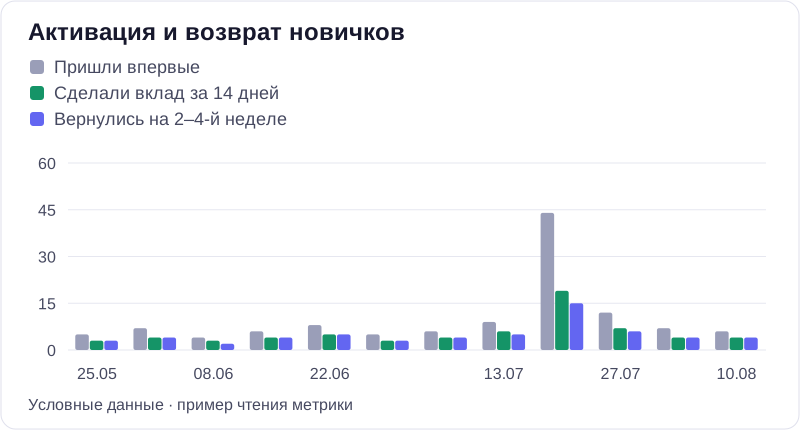
For each week of first appearance: how many joined, how many contributed within the first 14 days, and how many returned during weeks 2–4. This is the table reviewed after the distribution: a spike in entries is not the outcome; the outcome is the proportion of returners.
WITH first_seen AS (
  SELECT user_id, MIN(ts) AS first_ts FROM v_storm_user_actions GROUP BY user_id
),
newcomer AS (
  SELECT f.user_id, f.first_ts,
         BOOL_OR(a.family = 'contribution' AND a.ts < f.first_ts + INTERVAL '14 days')                  AS contributed_14d,
         BOOL_OR(a.ts >= f.first_ts + INTERVAL '7 days' AND a.ts < f.first_ts + INTERVAL '28 days')     AS returned_8_28d,
         BOOL_OR(a.family = 'contribution'
                 AND a.ts >= f.first_ts + INTERVAL '7 days' AND a.ts < f.first_ts + INTERVAL '28 days') AS contributed_8_28d
  FROM first_seen f
  JOIN v_storm_user_actions a ON a.user_id = f.user_id AND a.ts < f.first_ts + INTERVAL '28 days'
  WHERE f.first_ts >= NOW() - INTERVAL '26 weeks'
    AND f.first_ts <  NOW() - INTERVAL '28 days'      -- незавершённые недели не показываем
  GROUP BY 1, 2
)
SELECT date_trunc('week', first_ts)::date AS first_week,
       COUNT(*)                                     AS newcomers,
       COUNT(*) FILTER (WHERE contributed_14d)      AS contributed_14d,
       COUNT(*) FILTER (WHERE returned_8_28d)       AS returned_8_28d,
       COUNT(*) FILTER (WHERE contributed_8_28d)    AS contributed_8_28d,
       ROUND(100.0 * COUNT(*) FILTER (WHERE returned_8_28d) / COUNT(*), 1) AS returned_pct
FROM newcomer GROUP BY 1 ORDER BY 1;
4 Depth: core, active, episodic, dormant
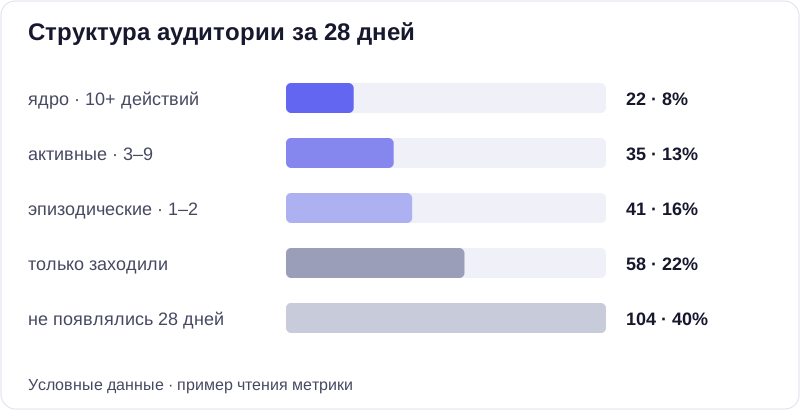
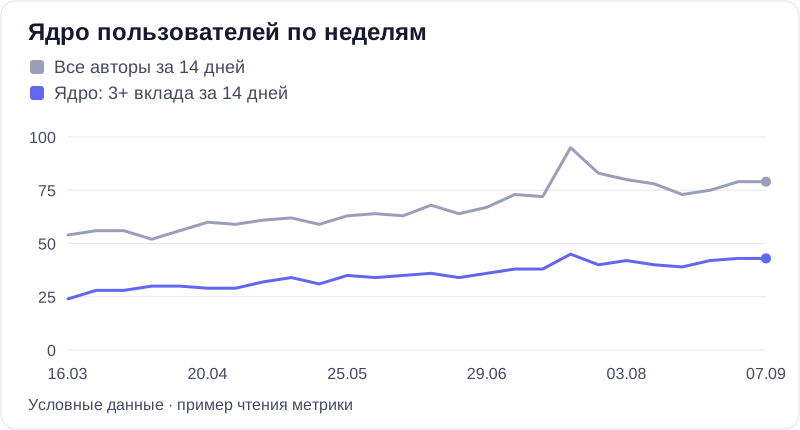
A 28-day snapshot for all included accounts. Thresholds for this recipe: core — 10 or more contributions over 28 days, active — 3–9, episodic — 1–2. This is a configurable segmentation; it cannot be directly compared with interface metrics without verifying the time window and event composition.
4a. Snapshot by Levels
WITH c AS (
  SELECT u.id AS user_id,
         COUNT(a.ts) FILTER (WHERE a.family = 'contribution') AS contributions,
         COUNT(a.ts) AS actions
  FROM sm_users u
  LEFT JOIN v_storm_user_actions a ON a.user_id = u.id AND a.ts >= NOW() - INTERVAL '28 days'
  WHERE u.enabled AND u.deleted_on IS NULL
  GROUP BY u.id
)
SELECT CASE WHEN contributions >= 10 THEN '1. ядро: 10+ действий'
            WHEN contributions >= 3  THEN '2. активные: 3–9'
            WHEN contributions >= 1  THEN '3. эпизодические: 1–2'
            WHEN actions > 0         THEN '4. только заходили'
            ELSE                          '5. не появлялись 28 дней' END AS tier,
       COUNT(*) AS users,
       ROUND(100.0 * COUNT(*) / SUM(COUNT(*)) OVER (), 1) AS pct
FROM c GROUP BY 1 ORDER BY 1;
4b. Core by weeks
Authors with three or more contributions over a rolling 14-day period, against all authors for the same period.
WITH weeks AS (
  SELECT generate_series(date_trunc('week', NOW() - INTERVAL '26 weeks'),
                         date_trunc('week', NOW()), '1 week')::date AS week
),
per_user AS (
  SELECT w.week, a.user_id, COUNT(*) AS contributions
  FROM weeks w
  JOIN v_storm_user_actions a ON a.family = 'contribution'
                             AND a.ts >= w.week + 7 - 14 AND a.ts < w.week + 7
  GROUP BY 1, 2
)
SELECT week,
       COUNT(*) FILTER (WHERE contributions >= 3) AS core_users,
       COUNT(*) AS contributors_14d,
       ROUND(100.0 * COUNT(*) FILTER (WHERE contributions >= 3) / COUNT(*), 1) AS core_pct
FROM per_user GROUP BY 1 ORDER BY 1;
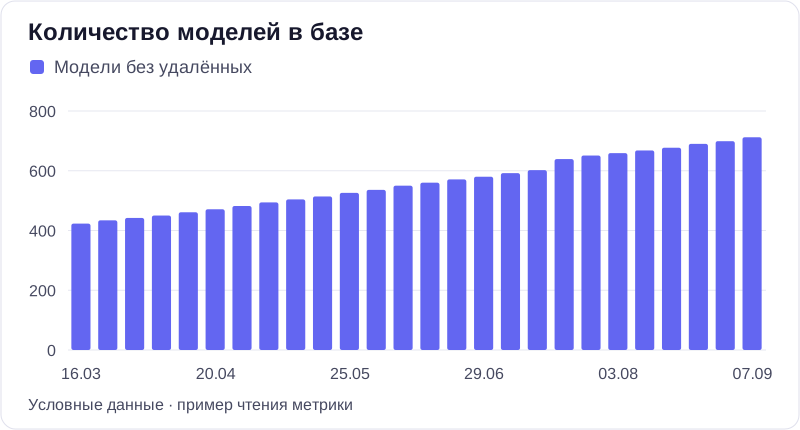
5 Is the process base alive
Adoption is not the number of models, but the share of models that someone has touched in the last 90 days. If the base grows while the share of active models falls, it means people are drawing and forgetting.
WITH weeks AS (
  SELECT generate_series(date_trunc('week', NOW() - INTERVAL '26 weeks'),
                         date_trunc('week', NOW()), '1 week')::date AS week
)
SELECT w.week,
  (SELECT COUNT(*) FROM sm_diagrams d WHERE d.created_on >= w.week AND d.created_on < w.week + 7)       AS diagrams_created,
  (SELECT COUNT(*) FROM sm_diagrams d WHERE d.deleted = false AND d.created_on < w.week + 7)              AS diagrams_total,
  (SELECT COUNT(DISTINCT v.diagram_uuid) FROM sm_diagram_versions v
    WHERE v.created_on >= w.week AND v.created_on < w.week + 7)                                           AS diagrams_touched_week,
  ROUND(100.0 * (SELECT COUNT(DISTINCT v.diagram_uuid) FROM sm_diagram_versions v
                   JOIN sm_diagrams d ON d.id = v.diagram_uuid AND d.deleted = false
                  WHERE v.created_on >= w.week + 7 - 90 AND v.created_on < w.week + 7)
        / NULLIF((SELECT COUNT(*) FROM sm_diagrams d WHERE d.deleted = false AND d.created_on < w.week + 7), 0), 1) AS alive_90d_pct,
  (SELECT COUNT(*) FROM sm_processes p  WHERE p.deleted = false AND p.created_on < w.week + 7)            AS processes_total,
  (SELECT COUNT(*) FROM sm_wiki_pages p WHERE p.deleted_at IS NULL AND p.created_on < w.week + 7)         AS wiki_pages_total
FROM weeks w ORDER BY 1;
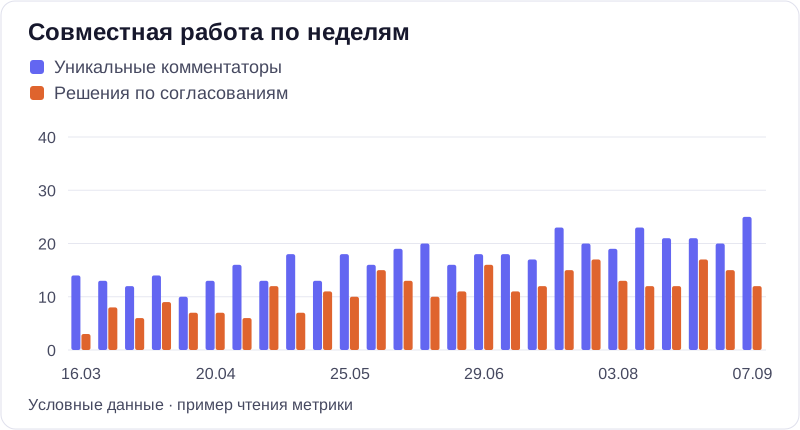
6 Collaboration
Solo modeling does not take root; it takes root when others read, comment on, and approve models. We look at comments, approvals, models with two or more authors, and invitations.
WITH weeks AS (
  SELECT generate_series(date_trunc('week', NOW() - INTERVAL '26 weeks'),
                         date_trunc('week', NOW()), '1 week')::date AS week
)
SELECT w.week,
  (SELECT COUNT(*) FROM sm_comments c WHERE c.created_on >= w.week AND c.created_on < w.week + 7)
  + (SELECT COUNT(*) FROM sm_comment_messages m WHERE m.created_on >= w.week AND m.created_on < w.week + 7) AS comments,
  (SELECT COUNT(DISTINCT uid) FROM (
      SELECT user_id AS uid FROM sm_comments WHERE created_on >= w.week AND created_on < w.week + 7
      UNION SELECT author_user_id FROM sm_comment_messages WHERE created_on >= w.week AND created_on < w.week + 7) t) AS commenters,
  (SELECT COUNT(*) FROM sm_approvals a WHERE a.created_on >= w.week AND a.created_on < w.week + 7)          AS approvals_requested,
  (SELECT COUNT(*) FROM sm_approvals a WHERE a.approval_time >= w.week AND a.approval_time < w.week + 7)    AS approvals_decided,
  (SELECT COUNT(*) FROM (SELECT v.diagram_uuid FROM sm_diagram_versions v
                          WHERE v.created_on >= w.week + 7 - 90 AND v.created_on < w.week + 7
                          GROUP BY v.diagram_uuid HAVING COUNT(DISTINCT v.user_id) >= 2) t)                AS diagrams_multi_author_90d,
  (SELECT COUNT(*) FROM sm_business_event e
    WHERE e.name IN ('diagram.invite_sent', 'team.invite_sent')
      AND e."timestamp" >= w.week AND e."timestamp" < w.week + 7)                                          AS invites
FROM weeks w ORDER BY 1;
7 AI Module
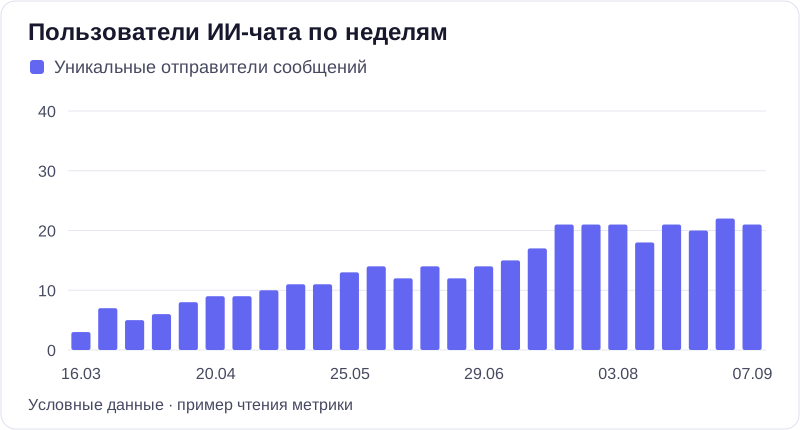
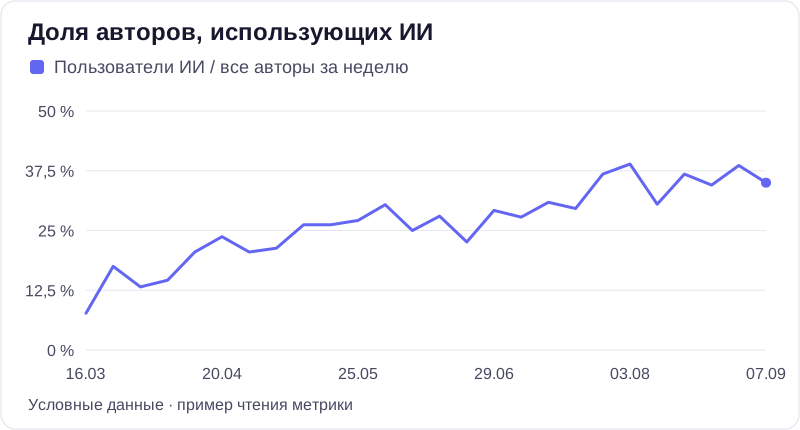
The share of authors who used AI within a week, the number of messages, response ratings, and requests via MCP — external agents.
WITH weeks AS (
  SELECT generate_series(date_trunc('week', NOW() - INTERVAL '26 weeks'),
                         date_trunc('week', NOW()), '1 week')::date AS week
),
ev AS (
  SELECT date_trunc('week', "timestamp")::date AS week,
         COUNT(DISTINCT user_id) FILTER (WHERE name = 'ai_chat_message_sent') AS ai_users,
         COUNT(*)                FILTER (WHERE name = 'ai_chat_message_sent') AS ai_messages,
         COUNT(DISTINCT user_id) FILTER (WHERE name LIKE 'mcp::%')            AS mcp_users,
         COUNT(*)                FILTER (WHERE name LIKE 'mcp::%')            AS mcp_calls
  FROM sm_business_event WHERE "timestamp" >= NOW() - INTERVAL '26 weeks' GROUP BY 1
),
fb AS (
  SELECT date_trunc('week', created_at)::date AS week,
         COUNT(*) FILTER (WHERE feedback = 'UP')   AS thumbs_up,
         COUNT(*) FILTER (WHERE feedback = 'DOWN') AS thumbs_down
  FROM sm_ai_chat_messages WHERE created_at >= NOW() - INTERVAL '26 weeks' GROUP BY 1
),
act AS (
  SELECT date_trunc('week', ts)::date AS week, COUNT(DISTINCT user_id) AS contributors
  FROM v_storm_user_actions WHERE family = 'contribution' AND ts >= NOW() - INTERVAL '26 weeks' GROUP BY 1
)
SELECT w.week,
       COALESCE(ev.ai_users, 0)    AS ai_users,
       COALESCE(ev.ai_messages, 0) AS ai_messages,
       ROUND(100.0 * COALESCE(ev.ai_users, 0) / NULLIF(act.contributors, 0), 1) AS ai_share_of_contributors_pct,
       COALESCE(fb.thumbs_up, 0)   AS thumbs_up,
       COALESCE(fb.thumbs_down, 0) AS thumbs_down,
       COALESCE(ev.mcp_users, 0)   AS mcp_users,
       COALESCE(ev.mcp_calls, 0)   AS mcp_calls
FROM weeks w
LEFT JOIN ev  USING (week)
LEFT JOIN fb  USING (week)
LEFT JOIN act USING (week)
ORDER BY 1;
8 What the mailing brought
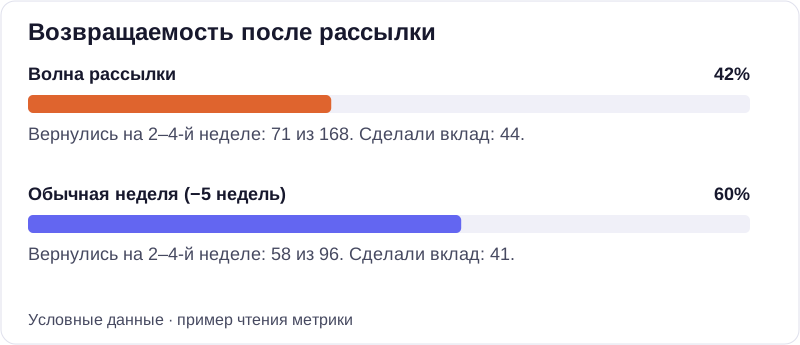
Two tables. The first covers the 28 days before and the 28 days after the mailing date: audience, authors, newcomers, and how many newcomers made a contribution. The second compares retention: people who joined in the first week after the mailing (the "wave") versus people from a regular week five weeks prior. We compare the share of those who returned in weeks 2–4.
8a. Before and after distribution
WITH p AS (SELECT DATE '2026-09-15' AS d0),                   -- дата рассылки
periods AS (
  SELECT 'до (28 дн)'    AS period, d0 - 28 AS from_d, d0      AS to_d FROM p
  UNION ALL
  SELECT 'после (28 дн)',           d0,               d0 + 28 FROM p
),
first_seen AS (SELECT user_id, MIN(ts) AS first_ts FROM v_storm_user_actions GROUP BY user_id)
SELECT pr.period,
  COUNT(DISTINCT a.user_id)                                                                       AS users,
  COUNT(DISTINCT a.user_id) FILTER (WHERE a.family = 'contribution')                              AS contributors,
  COUNT(*)                  FILTER (WHERE a.family = 'contribution')                              AS contributions,
  COUNT(DISTINCT a.user_id) FILTER (WHERE f.first_ts >= pr.from_d AND f.first_ts < pr.to_d)       AS newcomers,
  COUNT(DISTINCT a.user_id) FILTER (WHERE a.family = 'contribution'
                                      AND f.first_ts >= pr.from_d AND f.first_ts < pr.to_d)       AS newcomers_contributed
FROM periods pr
JOIN v_storm_user_actions a ON a.ts >= pr.from_d AND a.ts < pr.to_d
JOIN first_seen f ON f.user_id = a.user_id
GROUP BY 1 ORDER BY 1;
8b. Campaign Wave and a Regular Week
WITH p AS (SELECT DATE '2026-09-15' AS d0),                   -- дата рассылки
groups AS (
  SELECT 'волна рассылки' AS grp,          d0      AS from_d, d0 + 7  AS to_d, d0 + 7  AS ret_from, d0 + 28 AS ret_to FROM p
  UNION ALL
  SELECT 'обычная неделя (−5 нед)',        d0 - 35,           d0 - 28,          d0 - 28,             d0 - 7  FROM p
),
members AS (
  SELECT DISTINCT g.grp, a.user_id
  FROM groups g JOIN v_storm_user_actions a ON a.ts >= g.from_d AND a.ts < g.to_d
),
ret AS (
  SELECT m.grp, m.user_id,
         COALESCE(BOOL_OR(a.ts IS NOT NULL), false)          AS returned,
         COALESCE(BOOL_OR(a.family = 'contribution'), false) AS contributed
  FROM members m
  JOIN groups g USING (grp)
  LEFT JOIN v_storm_user_actions a ON a.user_id = m.user_id AND a.ts >= g.ret_from AND a.ts < g.ret_to
  GROUP BY 1, 2
)
SELECT grp, COUNT(*) AS users,
       COUNT(*) FILTER (WHERE returned)    AS returned_w2_4,
       COUNT(*) FILTER (WHERE contributed) AS contributed_w2_4,
       ROUND(100.0 * COUNT(*) FILTER (WHERE returned) / COUNT(*), 1) AS returned_pct
FROM ret GROUP BY 1 ORDER BY 1 DESC;
How to read. If the wave's return rate is no worse than that of a regular week, this is a positive signal; also check the contribution of new users and other events during the period. If it is significantly worse, users came to look and left; in that case, the next step is not another campaign, but a survey of those who did not return (list — query 9).
9 Who to work with individually
A list of people with their last registered action, last contribution, and action count. Sorted by time since last activity: at the top are candidates for a call or survey, or for license release.
SELECT u.id, u.email, u.fullname,
       CASE WHEN m.rights = 'VIEW' THEN 'просмотр' ELSE 'редактор' END AS role,
       u.create_on::date AS registered,
       MAX(a.ts)::date AS last_action,
       MAX(a.ts) FILTER (WHERE a.family = 'contribution')::date AS last_contribution,
       COUNT(a.ts) FILTER (WHERE a.family = 'contribution' AND a.ts >= NOW() - INTERVAL '28 days') AS contributions_28d,
       COUNT(a.ts) FILTER (WHERE a.family = 'contribution' AND a.ts >= NOW() - INTERVAL '90 days') AS contributions_90d,
       COUNT(a.ts) FILTER (WHERE a.kind = 'ai' AND a.ts >= NOW() - INTERVAL '90 days')            AS ai_90d
FROM sm_users u
LEFT JOIN (SELECT DISTINCT user_id, rights FROM sm_members) m ON m.user_id = u.id
LEFT JOIN v_storm_user_actions a ON a.user_id = u.id
WHERE u.enabled AND u.deleted_on IS NULL
GROUP BY u.id, u.email, u.fullname, m.rights, u.create_on
ORDER BY last_action NULLS FIRST;
For a participant in multiple teams, the query returns a separate row for each permission value. Identical permissions across multiple teams do not multiply the action count. To report on a single team, filter sm_members before joining with the log.
How to read: what is good, what is concerning, what to do
| Question | We look at | Good | Concerning | What to do |
|---|---|---|---|---|
| Are people using it | 1 · contributors_28d | grows or holds steady quarter over quarter | grows users_28d, but authors stagnate | people log in but do not work: training, templates, tasks "in the system" |
| Is there a habit | 1 · stickiness | holds within its own norm | slips | work has become episodic: embed Storm into regular processes — approval, audit |
| Do we retain users | 2 · cohorts | months 1–3 for new cohorts are no worse than older ones | each new cohort decays faster | the problem is in the first weeks — see request 3 |
| Do newcomers settle in | 3 · contributed_14d, returned_8_28d | half or more contribute within 14 days | contribution within 14 days is limited to a minority | the newcomer has no task: assign a specific model or process at the start |
| Is there a core | 4 · core_users, core_pct | the core grows in absolute terms | the core is the same five people, only "visitors" grow | adoption relies on enthusiasts — expand through them, mentors by department |
| Is the base alive | 5 · alive_90d_pct | stable or grows as the base grows | the base grows, but the share of active items falls | models are drawn "for the shelf": link them to the registry, approval, wiki |
| Is it collaborative work | 6 · commenters, diagrams_multi_author_90d | grows together with authors | there are authors, but no commenters | introduce approval via Storm instead of email |
| AI | 7 · ai_share_of_contributors_pct, ratings | the share grows, and there are more "up" ratings | the share does not grow after the announcement | demonstrate scenarios on the team's live processes |
| Email blast effect | 8 | the share of returnees in the wave is ≈ a normal week | the wave returned twice as poorly | survey non-returnees (request 9) instead of the next email blast |
All "good / concerning" metrics are relative to your own history. Comparing with others' numbers is useless: the norms differ between a team of 30 analysts and a company where Storm is open to 2,000 readers.
BI System Panel Layout
Any BI system on top of the data warehouse: each card is a single query from this document, with the visualization type chosen to highlight the key aspect.
| Card | Query | View |
|---|---|---|
| Audience and Authors | 1 | Lines: users_28d, contributors_28d, users_week, contributors_week |
| Stickiness | 1 | Line stickiness |
| Cohorts | 2 | Pivot: Rows cohort, Columns month_n, Value pct |
| Newcomers | 3 | Columns: newcomers, contributed_14d, returned_8_28d |
| Audience Structure (28 days) | 4a | Donut or Columns by tier |
| Core | 4b | Lines core_users, core_pct |
| Process Base | 5 | diagrams_total and processes_total as Columns, alive_90d_pct as a separate Line |
| Collaboration | 6 | Columns comments, commenters, approvals_decided |
| AI | 7 | ai_users as Columns, ai_share_of_contributors_pct as a Line, ratings separately |
| Newsletter | 8a, 8b | Two tables, move date d0 to a panel parameter |
| People | 9 | Table with search |
For weekly queries, the horizon is 26 weeks — adjust INTERVAL '26 weeks' to suit your needs. Cohorts use 12 months, segments use 28 days, and live models use 90 days. A week is ISO, starting on Monday. Updating the copy once a day is sufficient: no slice requires daily precision.